Order Flow is the stream of real buy and sell orders executed in the market at each price level: think of it like watching a crowd in a mall, you can see which group is moving where. Unlike standard volume, which only shows total activity, Order Flow distinguishes how much Buy vs. Sell happened at each price. When combined with a Footprint Chart (showing bid/ask within each candle), traders see the buyer-vs-seller battle in the finest possible detail.
Core Concepts of Order Flow
Delta
Buy Volume − Sell Volume: positive delta = buyers dominant, negative = sellers dominant
Footprint
Chart showing bid/ask within each candle: read absorption and imbalance with clarity
Absorption
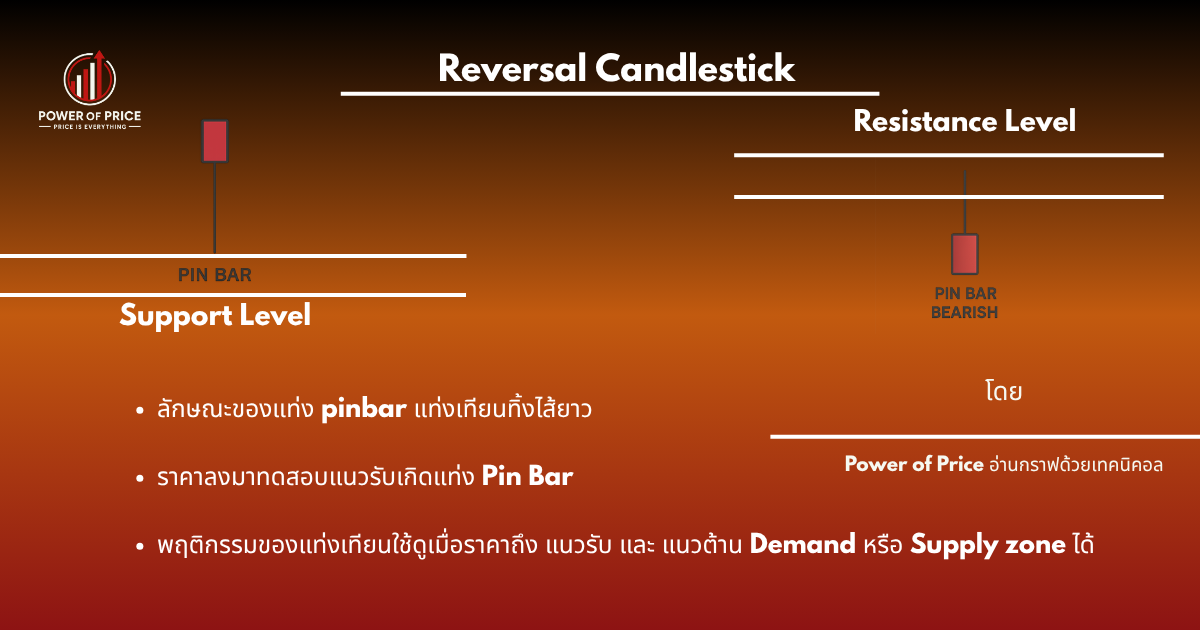
When large orders absorb selling/buying without price moving: a reversal signal
Imbalance
One side with significantly more volume: signals a strong directional bias
Move → Accumulate → Push
Markets cycle through 3 phases that Smart Money uses repeatedly. Order Flow helps you spot phase shifts before price reflects them:
Move
Price pushes hard one direction
Delta clearly one-sided
Accumulate
Price consolidates sideways
Smart Money accumulates
Push
Price breaks the range
With a delta surge
The highest-edge entry is in the Accumulate phase before the Push: wait until clear absorption or delta divergence appears, then enter.
Phase 1·2·3 Setup in Detail
Expanding M·A·P into fine-grained Phases: each Phase has distinct price behavior and candle shapes. Buy Setup = Move Down → Accumulate → Push Up. Sell Setup = Move Up → Accumulate → Push Down. Both sides must target Risk:Reward of at least 1:2, always.
Buy Setup · Bullish
Move Down → Accumulate → Push Up · Enter long when price returns to the zone
Sell Setup · Bearish
Move Up → Accumulate → Push Down · Enter short when price rebounds back to the zone
Always target Risk : Reward ≥ 1 : 2: risk 50 pips to target at least 100 pips in return. If a setup doesn't reach that ratio, skip it and find another.
Trend-Based Entry
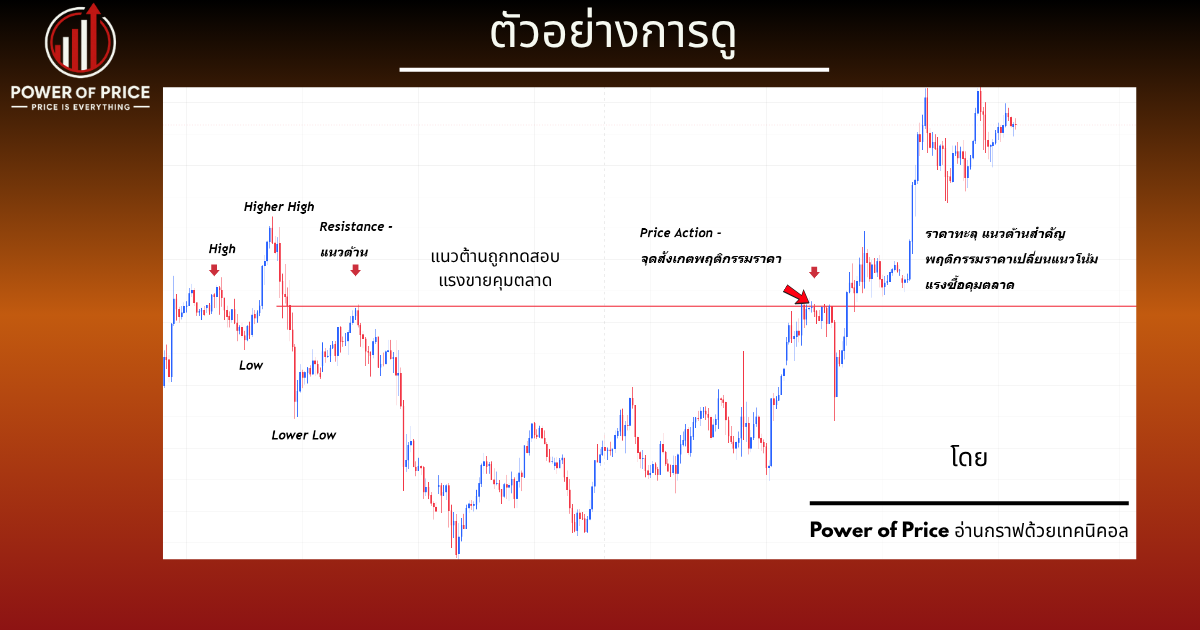
Once the trend structure is clear, look for M·A·P within that trend: Uptrend: look for Higher High / Higher Low · Downtrend: look for Lower High / Lower Low. This is the highest-probability entry because you're trading with the dominant Order Flow.
Uptrend · Buy Entry at HH/HL
- Higher High (HH): Price prints a new high above the previous high, confirming upside momentum is still intact.
- Higher Low (HL): Price pulls back but holds above the prior low → the best entry location in an uptrend.
Downtrend · Sell Entry at LH/LL
- Lower High (LH): Price bounces up but fails to clear the prior high → the best entry location in a downtrend.
- Lower Low (LL): Price prints a new low below the previous low, confirming downside momentum is still intact.
"Reading price is a skill": practice on backtest before you trade live. Define your setup plan, then decide: never enter on emotion. Every pullback inside a trend is a new opportunity.
Buyer Dominant vs Seller Dominant
Order Flow tells us "who controls the market right now?" by looking at cumulative delta and price action behaviour around key levels.
Seller Dominant
- Sell volume consistently exceeds buy volume
- Price makes Lower Highs and Lower Lows
- Footprint shows continuous negative delta (red)
- Most large orders sit on the Sell side
Buyer Dominant
- Buy volume clearly exceeds sell volume
- Price makes Higher Highs and Higher Lows
- Footprint shows continuous positive delta (green)
- Absorption occurs at key support levels
Delta Divergence: A Deep Reversal Signal
When price makes a new high but delta fails to make a new high (or flips negative) = divergence: signaling the latest move up wasn't backed by real buying pressure. Prepare for a reversal.
Real example: XAUUSD (Gold) prints a new high at 2,080 but delta drops from +5,000 to +2,000: a warning that buying pressure is exhausting, even though price keeps grinding up. A reversal usually follows within 2-3 candles.
Inversely, if price makes a new low but delta flips positive = bullish divergence. Buyers are absorbing at the lows, and selling pressure can't break them down.
Support & Resistance Imbalance
When price breaks a prior support or resistance with unusually strong Order Flow: that's an Imbalance that Smart Money created to shift the market. Zones where imbalance occurs are often retested and become key levels for future trades.
- Buy Imbalance: Order Flow breaks prior highs → old resistance becomes new support
- Sell Imbalance: Order Flow breaks prior lows → old support becomes new resistance
- Retest Opportunity: Price tends to retest that zone before continuing: the best entry moment
Imbalance is the footprint Smart Money leaves behind. Watch for volume spikes + unusually large candle bodies + gaps between candles: all three together form the strongest signal.
Combining Order Flow with Other Systems
Order Flow is most powerful when combined with other concepts:
- Order Flow + Supply/Demand: wait for price to return to the zone and check delta for a genuine reversal
- Order Flow + Market Structure: use delta to confirm whether BOS/CHoCH is real or a fake-out
- Order Flow + Key Levels: absorption at a key level = an entry with strong confluence
"Order Flow strategy helps find sitting buyers and selling orders in the market. Find your entry, take your profit, and protect your capital."
The Signature Reversal Setup: H&S + Liquidity Grab
The setup professional traders use to catch reversals with precision: Head & Shoulders combined with a Liquidity Grab is a pattern that appears daily on major charts (XAUUSD, BTCUSD, EURUSD). It carries a high win rate when you wait for the retest and don't rush entries at the breakout.
Signature BUY Setup
Inverse Head & Shoulders + Liquidity Grab below
- Left Shoulder: first Swing Low forms (price dips then bounces)
- Head: price drops deeper for a Lower Low, then recovers
- Liquidity Grab: price pierces below the Left Shoulder's low, sweeping retail stops
- Right Shoulder: price recovers but forms a Higher Low (above LS)
- Break Neckline: price breaks the neckline (resistance) upward with momentum
- Entry: Buy when price retests the neckline
- Stop Loss: below the Head's low
- Take Profit: 1:2 or 1:3 RR
Key Points
- Right Shoulder must sit higher than Left Shoulder
- Liquidity Grab is the earliest trigger signal
- Always wait for the retest: higher win rate
- Often coincides with a major Demand Zone
Signature SELL Setup
Regular Head & Shoulders + Liquidity Grab above
- Left Shoulder: first Swing High forms (price rallies then retraces)
- Head: price spikes higher for a Higher High, then collapses
- Liquidity Grab: price pierces above the Left Shoulder's high, sweeping short stops
- Right Shoulder: price recovers but forms a Lower High (below LS)
- Break Neckline: price breaks the neckline (support) downward with momentum
- Entry: Sell when price retests the neckline
- Stop Loss: above the Head's high
- Take Profit: 1:2 or 1:3 RR
Key Points
- Right Shoulder must sit lower than Left Shoulder
- Liquidity Grab is the earliest trigger signal
- Always wait for the retest: higher win rate
- Often coincides with a major Supply Zone
Never Rush In at the Breakout
Always wait for the retest: entries at the retest have a higher win rate and tighter stop losses. Many "breakouts" are fake-outs engineered by Smart Money as traps.
- A Liquidity Grab must occur (first signal)
- Shoulders must be asymmetric in the right direction (RS higher/lower than LS)
- Neckline break must come with clear momentum, not a slow drift
- Always wait for the retest before entering
- Risk-Reward at least 1:2
Common Mistakes
Trading Delta Alone
Positive delta isn't always a Buy signal: it needs context from structure and key levels to be valid.
Ignoring the Timeframe
M1 delta is extremely noisy: use M15 or higher for primary analysis.
Not Recognizing Spoofing
Large orders that appear and vanish quickly may be Smart Money spoofing: always check follow-through after orders show up.
Entering Because of FOMO
Chasing price on a breakout is a disaster. Always wait for the retest: even at the cost of missing some moves, it's safer than eating a quick stop-out.
Real Story from the Trading Arena
The signature Head & Shoulders + Liquidity Grab setup you just learned was put to the test in a real-world global trading competition. The result below demonstrates the power of Order Flow when executed with the right timing.
I used the Head & Shoulders + Liquidity Grab setup throughout XM's Seven-Day Showdown: scouting reversals that had a liquidity grab, then always waiting for the retest before entering. I never chased breakouts. The key was patience and solid risk-reward: at least 1:2.— @ppgolf · Thailand · Power of Price Member
3 Lessons from the Arena
Patience Wins Every Time
Waiting for the retest beats chasing out of fear. Fake breakouts are a trader's biggest enemy.
Risk Management Is Everything
Even with a high win rate setup, never compromise on RR: stick to 1:2 or better in every single trade.
The Setup Repeats Daily
H&S + Liquidity Grab shows up on major charts (XAUUSD, BTCUSD, EURUSD) every day. The faster you learn to spot it, the sharper your entries become.
Order Flow Checklist
- Identify the current phase: Move, Accumulate, or Push
- Check delta across the last several candles
- Look for delta divergence at key levels
- Confirm with market structure (BOS/CHoCH)
- Wait for absorption at the zone before entry
- Target RR ≥ 1:2 with SL behind the zone
4 Key Principles of Order Flow
Four principles to burn into memory: follow every one and Order Flow becomes the most consistent tool in your arsenal. Professional traders run every trade through this four-point filter.
Read Order Flow
Always map the Buyer / Seller Order Flow zones first · find a PriceAction Zone and wait for confirmation. Don't guess direction. Don't rely on indicators alone.
Identify M·A·P Phases
Spot Move → Accumulate → Push across every timeframe: this pattern repeats on every market. Know which Phase you're in before you decide.
Wait for Zone Confirmation
Let price reach the zone, then look for a confirmation signal (candle rejection · absorption · delta shift) before entering. Never enter before confirmation.
Always RR ≥ 1:2
Define Stop Loss and Take Profit every time · risk 50 to target 100+. Only take setups with good ratios: skip and move on if the math doesn't work.
Entry aligned with the Order Flow zone
Real Chart Example (XAUUSD 4h)
Let's look at a real XAUUSD 4h example where the Move → Accumulate → Push pattern played out cleanly: this is a setup that repeats daily on major charts. Train your eye to recognize it automatically.
This pattern repeats every single day: practice spotting it on backtests before trading live. Reading Order Flow is a skill that compounds over time, but once you master it, you'll see opportunities other traders miss entirely.