Market Structure is the skeleton of price movement: it's the language the market uses to tell us "who is in control right now?": buyers or sellers. Understanding Higher High (HH), Higher Low (HL), Lower Low (LL), Lower High (LH), and reversal signals BOS/CHoCH is the foundation of the Smart Money Concepts (SMC) framework that lets you read trends accurately and nail entry-exit timing.
Components of Market Structure
Uptrend
Sequential HH + HL: buyers control, entry at new HL
Downtrend
Sequential LH + LL: sellers control, entry at new LH
BOS (Break of Structure)
Price breaks the most recent swing high/low: confirms trend continuation
CHoCH (Change of Character)
The shift from HH/HL to LL/LH: the first signal of a reversal
4 Phases of the Market Cycle
Wyckoff showed that all markets at all scales cycle through 4 phases: knowing which phase you're in means knowing what to do:
Accumulation
Absorbing
Sideways Range
Markup
Push Up
Uptrend
Distribution
Offloading
Sideways Range
Phase 4: Markdown (down): the cycle repeats in a new wave
How to Read Structure from a Real Chart
Steps to mark structure on a chart:
- Identify swing points: clear highs/lows on your working timeframe
- Connect the points to see if price is making HH, HL, LH, or LL
- Identify the current trend: uptrend, downtrend, or range
- Look for BOS or CHoCH that signals a shift
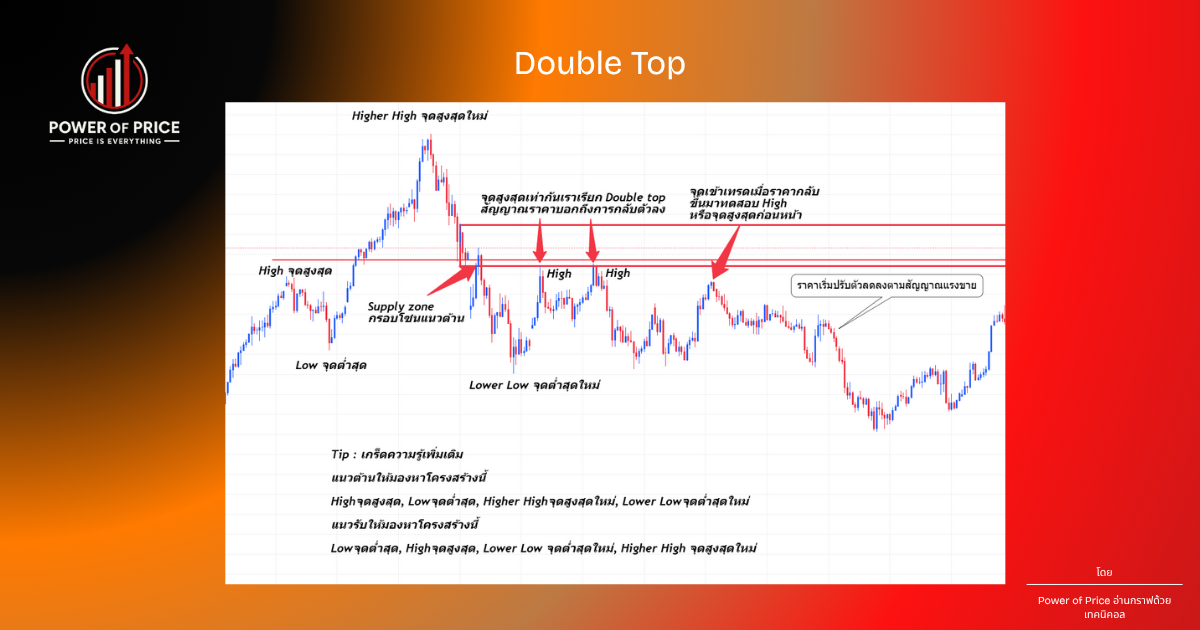
Double Top: Distribution Signal
When the market is in an uptrend and fails to make a new HH twice at the same level, together with a CHoCH below, it's a signal of Distribution phase: smart money is offloading position.
BOS vs CHoCH: The Critical Difference
These two signals look similar but point in opposite directions:
In uptrend: price breaks a new HH = BOS confirms the trend → enter at new HL
In downtrend: price breaks a new LL = BOS confirms the trend → enter at new LH
In uptrend: price breaks the latest HL = CHoCH, the first reversal signal → wait for new structure
In downtrend: price breaks the latest LH = CHoCH → prepare for a Buy
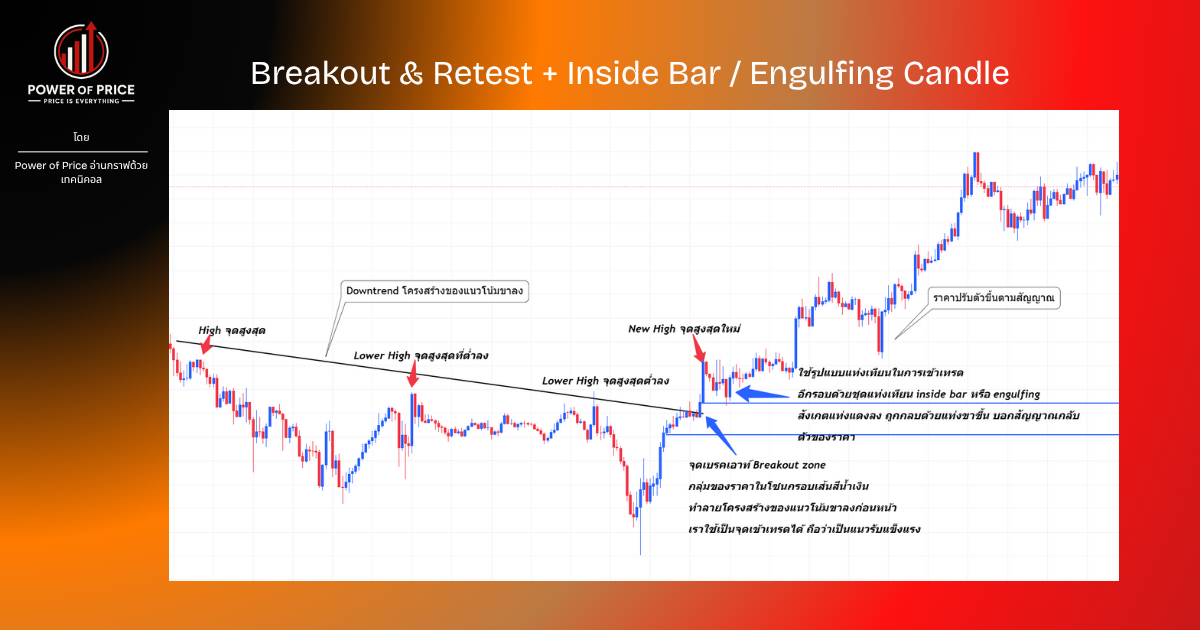
Combo Pattern: When Structure Meets Price Action
The strongest setup occurs when multiple concepts align: Market Structure + Supply/Demand + Reversal Candle Pattern in the same spot massively increases your odds.
Common Mistakes
Confusing BOS with CHoCH
BOS breaks with the trend, CHoCH breaks against the trend: telling them apart is the heart of SMC.
Trading BOS Without Waiting for Retracement
Entering immediately when BOS occurs risks getting retraced: wait for price to return and test the origin zone of the break.
Marking Structure on the Wrong Timeframe
M1 structure shifts constantly: use H1 or H4 as primary, and M15 for entry timing.
Checklist for Reading Market Structure
- Identify the current HTF trend (H4/Daily) first
- Mark the last swing high/low on the chart
- Know the phase: Accumulation, Markup, Distribution, or Markdown
- Identify the most recent BOS or CHoCH
- Wait for LTF confirmation with the same structure
- Identify liquidity pools (stop hunts) that may get swept